
Meteorology
Please wait for the page to fully load before starting your mission!
The Importance of my Job:
Remember, a successful sample retrieval is necessary for getting the samples back to Earth where scientists can study them for signs of past water and possibly life!
continue on to next section
Research
WEATHER AND CLIMATE
While weather refers to short-term changes in the atmosphere, climate describes what the weather is like over a long period of time in a specific area. When scientists describe an area's climate, they have often looked at averages of precipitation, temperature, humidity, sunshine, wind, and other measures of weather that occur over a long period in a particular place.
What we are discussing here is Mars' weather. Like Earth, Mars has seasons. In each case, these are primarily caused by each planet’s tilt on its axis relative to its orbital plane; the axial tilt for both planets is similar (23° for Earth and 25° in the case of Mars). However, the year on Mars is about twice as long as that of Earth, so the corresponding seasons on Mars are twice as long as well. There is also another factor in play. The orbit of Earth around the Sun is almost circular, and the slight variation in distance from the Sun plays little role. The orbit of Mars, on the other hand, is elliptical; its distance from the Sun varies quite a bit. The image below shows the orbits of Earth and Mars. Notice that the orbit of Earth is more or less circular, and centered on the Sun; that of Mars is more elliptical and not centered on the Sun.
When it is closest to the Sun (at "perihelion"), Mars gets a good deal more solar energy than it does at its furthest point (at “aphelion”). The more intense heating around the time of perihelion can cause dust storms to arise on Mars. Sometimes these storms are local and short-lived. Less frequently, they can become regional and last for weeks. Once in a while, global dust storms can occur. These can last for months and completely cover everything from the Mars surface to satellites in Mars' orbit.
Solar Illumination
Based on your prior knowledge of physics, you may know that the intensity of light falls off as the square of the distance from the source. Using this, we can figure out how much more sunlight is hitting a planet when it is closest to the Sun. The greater the difference in solar illumination, the more energy is available for weather phenomena (such as dust storms).
For example:
Let’s consider a fictional planet that is orbiting around our own Sun on an elliptical orbit.


How much more sunlight falls on the planet when it is at Perihelion than at Aphelion?
The answer must have something to do with how much closer the planet is at Perihelion than at Aphelion.
To compare the amount of light that falls on the planet at aphelion and at perihelion we can take the ratio of the two:
 For example, if:
A = 12 million Km
P = 4 million Km
 or the solar illumination at perihelion is 9 times bigger than at aphelion.
Now you can follow the steps below to determine how much MORE sunlight is hitting Mars at its perihelion than at its aphelion.
First, compare the distance at perihelion and at aphelion
At perihelion, Mars is 206.7 million kilometers from the Sun. At aphelion, it is 249.2 million kilometers away. To compare the two, divide Mars' perihelion distance by the aphelion distance. The aphelion distance is _____ times that of the perihelion distance.
Based on what we learned in our example with a fictional planet, to calculate how much more sunlight Mars gets at perihelion than at aphelion, you simply need to square the result you got above.
Notepad
CLICK HERE TO CHECK YOUR WORK FOR PERIHELION DISTANCE
Answer: A = 1.21 P
CLICK HERE TO CHECK YOUR WORK FOR ILLUMINATION RATIO
Answer: (A/P)2 = 1.45
This means that at perihelion Mars receives 1.45 times the amount of light that it receives at aphelion. Or we can also say that at perihelion it receives 45% more light than at aphelion.
continue on to next section
Archived Weather Data
DUST STORMS

A dust storm happens when there are strong winds that pick up dust from the surface of the planet into the air. Dust storms happen on Earth, as well as on Mars.
On Mars, dust storms are fairly common. Every year, there are multiple dust storms, which can be as big as one of Earth’s continents, and these storms usually last for weeks at a time. Every few years, Mars may have planet-wide dust storms.
These storms affect the opacity of the Martian atmosphere. The opacity is measured in units of tau (τ). A higher tau means more sunlight is blocked and power production goes down. Rovers such as Curiosity and Perseverance, which were powered by electricity generated by radioactive decay, were unaffected by the conditions. Solar powered rovers such as Spirit and Opportunity, on the other hand, live and die depending on the transparency of the atmosphere and the amount of solar energy their panels can generate.
The onset of dust storms can be fairly rapid. The graph below shows the measured or estimated tau values for Spirit and Opportunity over a 40-sol period:

continue on to next section
Analyze Current Weather Conditions
MEDA
Because Perseverance is still in the area, we can use these measurements for our mission.
In order to predict weather events on Mars, like dust storms, it is important to look at these measurements and see if there are any large changes from day to day.
ATMOSPHERIC OPACITY
A smaller number means that there is less dust in the atmosphere, so the sky looks clearer. A large number means that there is a lot of dust in the atmosphere, and the sky looks very dark.
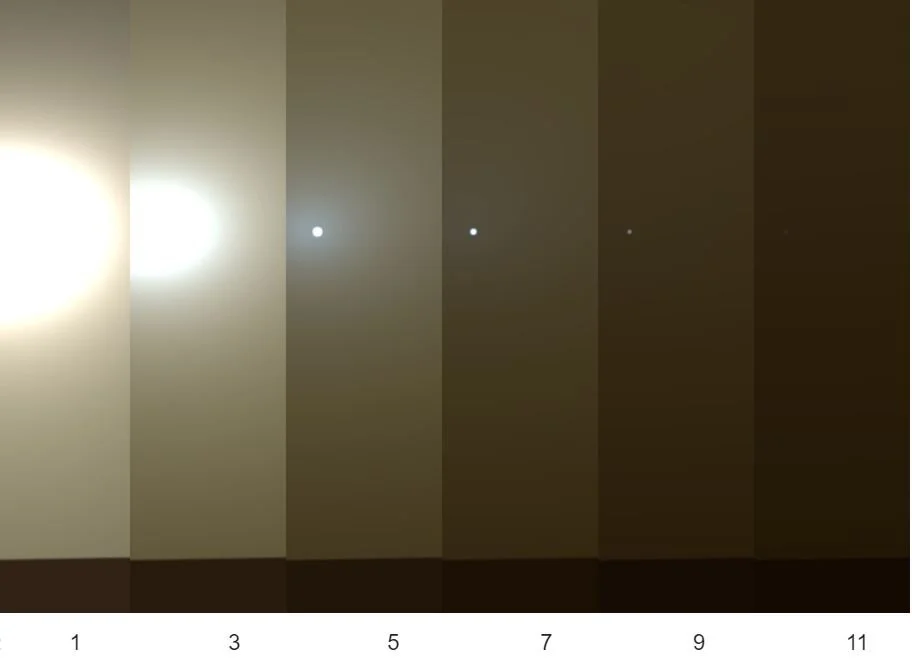
Sun size and clarity as Seen on Mars under Different Opacity Values as viewed from Opportunity Rover. The opacity levels are 1-11.


continue on to next section
Prepare Weather Report
WEATHER INTERACTIONS
The primary cause of wind on Mars is temperature differences in the air. Warmer air rises up, and cooler air then rushes in to replace the warm air. This is wind.
When wind speeds are high, the gusts of wind pick up particles of dust from the ground and carry them into the air. The more dust there is in the air, the higher the atmospheric opacity is, as the dust in the air blocks sunlight from reaching the surface of Mars.
Finally, dust on Mars absorbs sunlight. This means that air filled with dust is heated more by sunlight than air without any dust in it. So, when the atmospheric opacity rises on Mars, so does the air temperature.
Since all three environmental properties affect each other, any abnormal weather events that might affect one of them, such as an approaching dust storm, will be evident in the changes of all three properties.
It is normal for wind speed, air temperature and atmospheric opacity to fluctuate from one Sol to another, just as the temperature fluctuates from one day to another on the Earth. Typical average fluctuations, for each Sol, of these three environmental properties are shown in the table below that summarizes the range of variation that is considered normal. NOTE: a negative variation means a decrease in the value of that physical property.
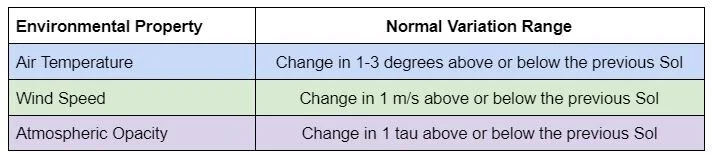
Environmental Property and Normal Variation Range Chart. Air Temperature’s Normal Variation Range is a change in 1 -3 degrees above or below the previous Sol. Wind Speed’s Normal Variation Range is a change in 1 m/s above or below the previous Sol. Atmospheric Opacity’s Normal Variation Range is a change in1 tau above or below the previous So
Condition Change Data Log
continue on to next section
IF you have determined that a dust storm is NOT approaching: Continue to the next section - Make a Final Decision
IF you have determined that a dust storm IS approaching:
Calculate Number of Sols Before Launch
WIND SPEED
If the wind speed is increasing by a relatively constant amount each sol, we can estimate how long it will be until the wind speed reaches 30m/s. This will tell us how long we have before the dust storm reaches its peak in our area.
Dust storms can last for days or weeks, and in some cases they can even last for up to two months.
Wind Speed
Notepad
continue on to next section
Make a Final Decision

Sample Image of where to find the pen tool, text tool, and more on the Mission Decision Board. The pen tool, post-it note and text box buttons are all to the left of the Mission Decision Board. The pen tool is first, the post-it note is fourth and the text box is seventh.
While you wait, did you know:

Image of a NASA building. A long standing tradition for JPL engineers is to share good luck peanuts during exciting points in new missions (like landing rovers on other worlds). This tradition started in 1964 at the Ranger 7 mission which followed six failures of the preceding Ranger missions. The peanuts were handed out in hopes of reducing some of the mission anxiety, and with the success of Ranger 7 the peanuts stayed around to hopefully bring success to future missions.
Congratulations, MET, and here’s hoping for a successful mission ahead!
Select Next Path
Once the rover successfully returns the samples collected on the path chosen by NAV, it is time to plan for a second Sample Fetch Rover mission. If you were to send the rover to a second depot, which path would you select? Follow the directions below to select which path the rover should visit next.

Diversity of samples that may be discovered within the mission. 20 samples inside the Jezero system and 17 outside the Jezero system.

Diversity of samples broken down into four groups. Path A, 7 samples. Path B, 6 samples. Path C, 7 samples. Path D, 17 samples.